


Facts You Never Knew About Most Probable Sum of Rolling Two Dice Before:
Understanding of Most Probable Sum of Two Dice
Abstract
Probability is a mathematical concept that humans use in their daily life knowingly or unknowingly. While making decisions every day, people use probability as mostly we must choose something from different options without unknowing what will be the outcome. Thus, it is essential to understand such useful concept. That knowledge can be attained by doing an experiment with two dice. An experiment was performed involving probability using two identical cubic dice to demonstrate the most probable sum of two rolling dice. The number on each die and the sum of both die was recorded from throwing two dice 500 times. The frequency and probability of each sum was calculated using Excel Spreadsheet and then graphed for visual understanding. After analyzing the result of the experiment and comparing it with other studies done by experts, it was concluded that the most probable sum of two dice was seven, with probability of 16.667%. So, this lab report shows that the probability of getting different outcomes is unequal.
Introduction
Suppose if someone rolls two dice simultaneously, which of the following has a greater probability? A) Getting a sum of 10, B) Getting a sum of 7, C) Both A and B have the same chance. A lot of people might choose the third option, thinking that there’s equal possibility of getting different outcomes. According to Lecoutre and Rezrazi (1998) this is a misconception, known as Equiprobability bias. It is very closely related to the branch of mathematics called probability. Now one can ask what is probability? Dr. Eric M. Baer defined probability as “the study of the chance that a particular event or series of events will occur.” For instance, The National Weather Service provides forecast such as 90% chance of rain based on the probability calculation done by using past data of temperature, wind, precipitation, and humidity. Since probability is an important part of daily life, by performing a simple experiment using two dice I attempted to have a better understanding of the logic behind it. So, the purpose of this experiment was to demonstrate that the probability of getting different outcomes, in this case different sum of two rolled dice is not equal. In other words, let’s say after performing three trials, the sums of two rolled dice are x, y and z. The probability of getting the sum, x could be higher than the rest. From my knowledge of mathematics, I predicted that getting a sum of seven has a greater probability.
Materials and Methods
Materials:
The experiment was designed into two parts, experimental section and software programing section.
- Experimental section: Materials used for this section were two identical cubic dice with dimension of 1.2 cm on each side, which is a very common die with the sum of opposite faces equal to seven. Also, two clear plastic disposable cups with 12-ounce capacity.
- Theoretical section: Software programing, Microsoft Excel was used to obtain data and plotting.
Methods:
- To perform the experiment, two dice were dropped into two clear plastic cups separately. Put hands on top of each cup’s mouth and shook both cups. Then rolled dice on the table. Followed this procedure to get 500 sample data.
- Set up an Excel Spreadsheet with three columns, number of dice thrown, number on die one and number on die two. Recorded the data acquired from 500 dice throws.
- After that, for the second part of the experiment, set up a table with three columns again, same as mentioned above. But this time, use Excel built-in function RANDBETWEEN to get 500 random points in between one to six for two theoretical dice.
- Next, used Excel built-in function SUM to add the numbers from two dice for experimental and theoretical parts of the experiment.
- From the sum columns of both parts, Excel built-in function FREQUENCY was used to calculate how many times each sum showed up in 500 throws.
- Finally, two frequency vs sum graphs were drawn for each part as well as both graphs were plotted to compare both parts of this experiment.

Results
After collecting the data from both part of the experiment and graphing to get a visual representation, I did some calculation to verify whether the experimental result correlates with the study done by experts. First I calculated the probability of getting a sum of two rolled dice using the following formula. The probability of two dice having a sum is denoted by P(A).
P(A)= Possible number of favorable outcome of sum/Total number of possible outcome (1)
The probability of two dice having P(A) = 2 is (1,1), which means the number of favorable outcome is one. Using the formula to get P(2) =1/36 .
So, using equation (1), one can obtain the following information.
| Sum | Sample space | P(A) | Percentage of P(A) |
| 2 | (1,1) | 1/36 | 2.778 |
| 3 | (1,2), (2,1) | 2/36 | 5.556 |
| 4 | (1,3), (2,2), (3,1) | 3/36 | 8.333 |
| 5 | (1,4), (2,3), (3,2), (4,1) | 4/36 | 11.111 |
| 6 | (1,5), (2,4), (3,3), (4,2), (5,1) | 5/36 | 13.889 |
| 7 | (1,6), (2,5), (3,4), (4,3), (5,2), (6,1) | 6/36 | 16.667 |
| 8 | (2,6), (3,5), (4,4), (5,3), (6,2) | 5/36 | 13.889 |
| 9 | (3,6), (4,5), (5,4), (6,3) | 4/36 | 11.111 |
| 10 | (4,6), (5,5), (6,4) | 3/36 | 8.333 |
| 11 | (5,6), (6,5) | 2/36 | 5.556 |
| 12 | (6,6) | 1/36 | 2.778 |
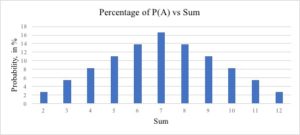
Figure 2: The probability, P(A) of having a sum from 2 to 12 and the percentage of P(A).
Using the values from Figure 2, another graph was plotted to see how the sum and the percentage of P(A) are related to each other. Figure 3 is the visual representation of their relationship.
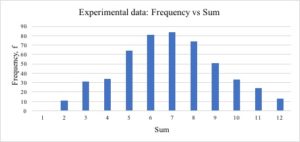
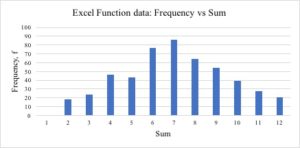
Since, the traditional as well as the advanced way (technological) of completing the experiment provided frequency and sum of dice, graphing the acquired values gave a clear understanding of which sum repeated the most. Following are the two graphs of frequency vs sum to highlight which sum had the greater probability of occurring.
Analysis
According to the graphs, it was concluded that the sum seven has the greatest probability in the conducted rolling two dice experiment. From figure 2, it is very clear that the probability of having the sum seven from rolling two dice is the highest, which is 17%. Since, figure 2 was obtained using the formulas that mathematician came up with using their years of experience, it is very crucial that the experimental (figure 4) and the theoretical data (figure 5) have as much similarity as possible. Thus, to analyze the data, a comparison graph was very helpful. The comparison graph looks as follows.
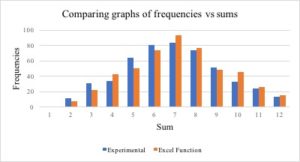
From figure 6, one can say that at seven the graph reaches its peak. From experimental data, the frequency of getting a sum of seven was 84, while for data gotten from Excel function had the frequency of 93 at seven. Also, if we want, we can compare the results with the empirical approach of solving probability. Empirical approach is “relative frequency of the occurrence of an event and is determined by actual observation of an experiment.” The following chart provides an easy visual understanding of empirical approach.
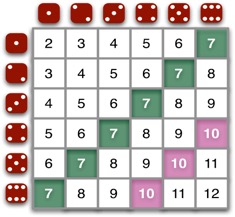
As we can see, the probability of getting a sum of ten is three, while there are six ways of getting a sum of seven. So, the probability of getting a sum of seven is highest.
In addition to that, many studies were done to show the effectiveness of this probability theorem. For instance, according to the study performed by Peter Bryant, Terezinha Nunes, Deborah Evans, Laura Gotardis, and Emmanouela Terlektsi (2014) from the Department of Education and Psychology of the University of Oxford and the Oxford Brookes University, “The probability of the two dice adding up to 7 is actually 6 times the probability that they will add up to 12, or add up to 2. This is because there is only one way of throwing a total of 2, both dice coming up as 1, but six ways of throwing a total of 7, 1 and 6, 2 and 5, and so on.” From figure 2, the probability of getting a sum of two or 12 is 2.778, while the probability of having seven as a sum is 16.667. So, probability of sum of seven is six times probability of the sum of two or 12. Also, while comparing the experimentally found frequency at two (11, figure 4) to frequency at seven (84, figure 4), we can conclude that the probability of having the sum of seven is over six times the probability of having a sum of two. For the experiment, seven showed up 84 times out of 500 sample data (figure 4). Even though the graphs look very accurate, I calculated the percent error to see how accurately the experiment was performed.
Percent Error= (Experimental Value – Accepted Value)/Accepted value (2)
= (0.168-0.167)/(0.167)
=0.599%
The experiment was performed very carefully and precisely, therefore the percent error was very small. Also, we should keep in mind that because of using Excel the values are constantly changing, but always follows the rules established here. Over all, sums six and eight have high probabilities but seven has the highest probability among all.
Conclusion
Briefly, the experiment was designed and performed to determine whether the probability of getting different sums from two rolling dice had equal possibility. After performing and analyzing the experiment, it was concluded that seven was most probable sum of two rolled dice.
Using the cups to shake dice vigorously, ensured that each die had random rolls. Consequently, the experiment very successful correlated with the theoretical data with an error percentage of 0.599. Peter et al. (2014) mentioned in the article that “In 6 of the 36 possible outcomes in the two-dice problem the numbers on the two dice would add up to 7: so the probability of throwing a total of 7 is 6/36.” The results of the experiment showed that, the probability of getting seven as the sum of numbers on two dice was 16.8%, which is close to the result of the study mentioned earlier. As I predicted that the sum of two dice would be seven before performing the experiment, after analyzing the result I concluded that my prediction was correct. In the future, it will be interesting to perform other experiments to observe how different factors such as friction of the table, gravity, material and shape of the die would affect the outcomes.
Work Citation
Ang, L., H., Shahrill, M. (2014). Identifying Students’ Specific Misconceptions in Learning Probability, International Journal of Probability and Statistics, Vol. 3 No. 2, 2014, pp. 23-29. doi: 10.5923/j.ijps.20140302.01.
Baer, E., M., Dr. (2018, October 23). Teaching Quantitative Skills in the Geosciencs. Retrived from https://serc.carleton.edu/quantskills/methods/quantlit/ProbRec.html
Empirical Probability Formula. (n.d.). Retrieved from http://www.probabilityformula.org/empirical-probability-formula.html
Bryant, P., Evans, D., Gotardis, L., Nunes, T., Terlektsi, E. (2014). Learning that Randomness is Fair but Loaded Dice are not. Journal of Mathematics Teaching, (242), 4-8.

This entry is licensed under a Creative Commons CC0 1.0 Universal Public Domain Dedication license.